Saturday, January 31, 2009

We All Need To Remember Herbert Hoover

Columnist Colbert I. King writes in the Washington Post that "Republicans need to remember Hoover". I agree with that, indeed I think that everyone -whether Republican or not- should remember Hoover.

However, they should remember the real Hoover, not the mythological version. Colbert certainly doesn't seem to remember the real Hoover as he claims that:


"In truth, what really gets them [Republicans] hot and bothered is the thought of government taking on more responsibility to fight this deepening recession, and the huge amount of public spending it will take to pull the economy out of the doldrums.

It so happened that the Republican standard-bearer in the 1920s, Herbert Hoover, felt that way, too.

Hoover's distaste for government, and his belief that business was the answer to the country's economic tailspin, got Democrat Franklin Delano Roosevelt elected president in 1932
"

Hoover was hardly the "standard-bearer in the 1920s" as he became President only in March 1929. And he definitely did not have "distaste for government". As Rothbard documents in his boom America's great depression ( An excerpt from the chapter specifically on Hoover can be read here) he was the most activist government the United States had ever had at the time, and expanded government more than anyone had in peace time. And you don't have to read Rothbard to get that confirmed. As you can see on the Bureau of Economic Analysis web page, government purchases increased from 9.0% of GDP in 1929 to 14.8% in 1932 and in fact increased in not just in relative but in absolute terms in both 1930 and 1931.

Add to that Hoover's protectionism and his wage controls, and you can see that he had anything but "distaste for government".

Bruce Bartlett vs. Bruce Bartlett

Bruce Bartlett criticizes Republicans for "not adapting to the welfare state", arguing that it is not politically realistic to demand cuts in popular entitlement programs.

Uhm, wait a minute, didn't Bartlett write a book called "Impostor" as late as 2006 criticizing them precisely for adapting to the welfare state. The whole reason that Bush pushed through the Medicare drug benefit bill that Bartlett criticized him for in Impostor was that Bush knew it was popular among seniors, in other words Bush adapted to the welfare state because he knew it was necessary to get elected (his opponent in 2000, Al Gore, had also promised a similar bill), precisely what Bartlett now says Republicans should do.

So, which is it, should Republicans adapt to the welfare state like Bartlett now says or should they not do so like he said 3 years ago? Of course, people should be free to change their minds, but then Bartlett should reject his own book as flawed. One almost gets the impression that for Bartlett, all that matters is that he can pose as a "critical voice". Whether the critique is about Republicans wanting to spend too much or too little doesn't really matter as long as he gets to be critical.

Fed Balance Sheet Is Shrinking Again

Unnoticed by most, the Fed balance sheet has started to shrink, after its unprecedented increase last year. After having increased from $888 billion in the week to September 10, to $2,247 billion in the week to December 31, it has since fallen 4 straight weeks in a row to $1,990 billion in the week to January 28. And that latter figure was a weekly average, the absolute level on January 28 was $1,911 billion. This reflects mainly a decline in commercial paper holdings, but many other items including "Term Auction Facility", repurchase agreements and "other loans" also declined significantly.

It is not certain just what this mean. It could be just a temporary decline, before a possible coming expansion in Treasury holdings. And the absolute level of reserves is certainly still more than enough to fuel money supply expansion. However, because of the Fed's new rule of paying interest on reserves and because of the weak underlying economy, a far higher level of reserves than before will be required to expand money supply. And so, if the trend continues, it could cut monetary expansion short before it has begun to bid up prices outside of the fixed income markets.

So far though, this new trend has only had an impact of the very narrow M1 aggregate. Broader and more relevant aggregates like M2 and MZM continued to expand in the latest report, though it should be noticed that these numbers lag reserve figures by 9 days, as the latest numbers refer to the week ending January 19.

Again, no clear conclusions can be made at this point about what will happen and the main scenario is still that the Fed will continue to inflate, but if (with emphasis on "if") this decline in the Fed balance sheet continues then it will likely start to affect the broader monetary aggregates too.

Friday, January 30, 2009

Japanese Economy Going Of A Cliff

Illustrating further the point I made in the previous post, the yen rallied this morning further. The news that triggered this rally was that unemployment in Japan soared (from 3.9% to 4.4% in one month) and that industrial production fell 9.6%-in one month. Compared to 12 months earlier industrial production fell 20.6%.

While it is not the only reason, one key reason for the increasingly depression-like conditions in Japan is the overvalued yen which is rapidly killing off tradable goods industries in Japan. And while non tradable goods sectors can enjoy lower input costs, demand from the tradable goods industries is disappearing so fast that they might lose too from the overvalued yen.

And as the overvalued yen sends the Japanese economy into what increasingly looks like a depression, this will only make the yen even stronger, so creating a vicious spiral for Japan.

Thursday, January 29, 2009

Weaker U.S. Economy Makes U.S. Dollar Stronger

The reports released today on the U.S. economy all indicated that it remains extremely weak, with the number of people receiving unemployment benefits reaching an all time high in absolute numbers (though it is still well below the 1982 peak levels as a percentage of the work force) while both durable goods orders and new home sales dropped more than most analysts had expected.

Normally, when economic reports are weak the exchange rate of the currency of that country falls, yet as is reported here, currency traders reacted by pushing the U.S. dollar higher against the pound and the euro (though not against the yen).

This might seem strange, but it's not if you remember what I wrote last week about the link between stock markets and the yen. The U.S. has short term interest rates at zero and so they can't be lowered further in response to economic weakness. The ECB still has rates at 2% so they can be lowered by 2 more percentage points. And since a weaker U.S. economy increases the risk for a weaker European economy, a weaker U.S. economy will increase the risk of more ECB interest rate cuts, which will lower the interest rate differential.

One argument sometimes used for floating exchange rates is that the currencies of weak economies will weaken which will boost that economy by supporting exports. Yet as we see here, once interest rates reach zero, the effect will be the opposite, and a weaker economy will cause the currency to rise in value and so hurt exports.

European Money Supply Growth Accelerates

Today, money supply statistics for both the Euro area and Sweden were released, and in both cases did money supply growth accelerate following interest rate cuts. And perhaps not surprisingly, the acceleration was sharpest in Sweden which had the most radical rate cut. M1 rose 3.2% in the year to December in the Euro area, up from 2.2% in the year to November. In Sweden, the annual growth rate picked up even more, from 3.0% to 5.4%.

Wednesday, January 28, 2009

Say What?

OK, now let's see here, some economist by the name of Harm Bandholz have discovered that real M2 growth does not correlate with current economic activity, as measured by the index of coincident indicators. From that he concludes that it should not be included in the index of leading indicators. Huh? Since when is the index of leading indicators supposed to correlate with current activity? Isn't the whole point of having a distinction between coincident and leading indicators that the former should correlate with current activity, while the latter shouldn't necessarily do so? If the leading indicators are supposed to correlate with current activity, what's the point of distinguishing between coincident and leading indicators?

If he had shown that it was not a good leading indicator, much worse than the other leading indicators, then he would have had an argument for excluding it. But from the fact that it is not a coincident indicator it doesn't follow that it's not a leading indicator.

"Stimulus" Will Lead To Permanent Government Expansion

Former McCain economic advisor Kevin Hassett has a really strange column arguing that Obama will be "a small government liberal". He bases this on comparing some CBO forecast of spending for fiscal 2009 with one for fiscal 2019. The fiscal 2009 forecast will include outlays for TARP and for the coming "stimulus package". This reasoning is really strange because first of all because CBO forecasts are based on the assumption of no policy changes and because unless the constitution is changed, Obama will have been out of office for at least 2 years by 2019. Not to mention the fact that Obama supported TARP (He voted for it in the Senate) and of course the "stimulus package" which Obama without any involvement from Bush will put forward. Yet he still wants to attribute both to Bush and none to Obama. With advisors like that, it is little wonder that McCain lost. Though perhaps Hassett is still grumpy about the comments McCain about him (and other economic advisors) so that Hassett now wants to avenge that by trying to make Obama look good.

A more rational analysis is provided here by Jim Manzi. Even though the proposed stimulus package is supposed to address the current cyclical slump, only a small part of the increase in spending will actually be implemented in 2009, and with nearly half being implemented after 2010. A much higher proportion of the tax cuts will be immediately implemented, with almost nothing remaining after 2010. And at that time the Bush tax cuts will expire, meaning that significant tax increases will come then.

And as Manzi points out, the risk is high that once the supposedly temporary spending programs are in place, supporters of them will argue that by extending them they're not increasing spending, they're avoiding cuts, something which will increase the likelihood that an even greater proportion of the spending increase will remain after 2010, making it in effect permanent. There are precedents for this, including how the reason the United States has farm subsidies is that the government wanted to provide "temporary" relief for farmers during the Depression of the 1930s. That "temporary" program however is still in place.

Tuna Inflation Made In Somalia

Despite the presence of military ships from several countries outside the coats of Somalia, Somalia-based sea piracy remains a problem. The most obvious effect of this is increasing shipping costs as insurance premiums rises and as ships going from Asia to Europe avoid the Gulf of Aden and instead travels the Cape of Good Hope at the southern tip of Africa.

It will now also raise the price of tuna as fishing fleets increasingly stay away from the tuna rich waters outside Somalia, something which has resulted in reduced catches and therefore higher prices.

Tuesday, January 27, 2009

The Effects Of The 2003 Tax Cuts

Mark Thoma reports about a study about the 2003 Bush tax cuts from the Economic Policy Institute, which (much like Thoma) is leftist. The conclusion, not surprisingly, is that the tax cuts failed to generate growth

The argument that the tax cuts failed to generate growth is made on the basis of comparing actual job growth with an old forecast of job growth. Since actual job growth was lower than the forecast, this supposedly proves that it failed. Yet if you actually look at the chart all it proves is the uselessness of these forecasters since they predicted significant job growth months before the tax cuts, when in reality job growth was negative then.

First, it should be emphasized that economic theory cannot be proved or disproved on the basis of statistical data. Causal relationships are established through praxeological reasoning (for an example of this see here). And the main argument for catital gains and dividend tax cuts is that they will increase growth by improving the incentive for investments and also by allowing successful investors to keep more of their money and so increase their access to capital.

Still, empirical data can be useful in suggesting whether a particular factor had a significant impact in a particular time period and place. And what does the evidence suggest about the 2003 tax cuts? Not that they created some kind of permanent era of high growth as supply-siders at the time argued, nor that they had no or negative impact as leftists argue, but that they did provide a boost to economic growth which was significant, though not dramatic.

If we first of all look at jobs, J-O-B-S, that 3 letter word according to current vice president Joe Biden, it so happens that private sector employment (governments don't pay capital gains taxes and so shouldn't be included) fell from January 2001 to July 2003, which is to say it kept falling until a few months after the 2003 tax cuts.

A more specific way of testing the significance of the tax cuts would be to look at the item we would expect to be most affected by such cuts, namely business investments. Business investments fell sharply during the recession and kept falling even after it had ended, reaching a low in the first quarter of 2003, when the tax cuts were proposed, recovering after that.

Between the fourth quarter of 2001 and the first quarter of 2003, the recovery was to say the least sluggish with private sector employment falling and with GDP rising during those 5 quarters at an annual rate of just 1.7%. And moreover, in those 5 quarters the share of GDP going to government demand rose from 18.3% to 19.2%, while that going to housing rose from 4.7% to 5.0%. Excluding government and residential investments, GDP rose just 0.5% in those 5 quarters, or 0.4% at an annual rate. A lower rate of increase than the population growth of roughly 1%.

And even that 0.5% increase depended on an increase in consumption financed by rising house values, which enabled households to use their homes as ATMs, so to speak. In short, until mid-2003, economic activity outside of government and housing were contracting. But after that a significant recovery began, as private sctor employment finally starting to rise and with economic growth accelerating and that recovery were particularly strong in the sector that capital income taxation according to economic theory would have predicted to have the greatest impact, which is to say for business investments.

Also, the tax cuts seems to have boosted the dividend payout rate, which will have a positive effect on long term growth by encouraging redistribution of savings from older companies with little expansion possibilities to new companies.

In short: since the recovery significantly accelerated after the tax cuts and since the recovery was specifically concentrated in the sector where economic theory would predict it would be if it was caused by the tax cuts, it is clear that it is likely that they did in fact have a significant positive impact. Not as dramatically positive as some of the exaggerated assertions of certain supply-siders would suggest, but it is clearly significantly positive.

Sunday, January 25, 2009

Recessions-Good Times For New Businesses?

Interesting article about how many new businesses are started during recession, including many companies that are now very large, such as Microsoft, General Electric and CNN.

Of course, there are a lot of new businesses started during booms as well but this illustrates that it can be done during recessions as well. But how is that possible considering how credit conditions are tighter and "aggregate demand" falling? The article does not try to answer that.

The answer can be found if you consider Austrian theory, including that of proto-Austrian Jean-Baptiste Say. The cause of recessions isn't "insufficient aggregate demand" as there are always needs and wishes that aren't met. The problem is instead that factors of production have been wasted through malinvestments, so that people cannot offer the goods and services needed to buy the goods and services they want. Demand is in other words lower because supply is also lower. And the reason supply is falling is because factors of production aren't used because they have been diverted to malinvestments.

But while people have increased difficulty to afford the things they want, the increased amount of unused factors of production also means that entrepreneurs will have more means at their disposal to satisfy whatever desires people can still afford to meet, thus to some extent counteracting the effects of lower production of other goods. And once there is a more general economic upswing, those astute entrepreneurs that acted during the slump will still have those extra factors and make it easier to for them to expand than if they had started their businesses during booms when there are shortages of workers and capital goods.

It can be argued whether really recessions are a better time to start businesses as the article claims. But clearly it is not as difficult as Keynesian analysis would suggest, and the explanation for this can be found using Austrian analysis.

Saturday, January 24, 2009

Interesting Article About Peter Schiff

CNN Money and Fortune Magazine has a really interesting article about Peter Schiff that I recommend you to read.

Today's Quote

"A weak currency arises from a weak economy which in turn is the result of a weak Government."

This is how U.K. Prime Minister Gordon Brown commented the decline in value of the pound back in 1992 after it left the ERM, during a time when there was a Tory government. I bet you won't hear him say that now......

Friday, January 23, 2009

Fed Stands Ready To Monetize Deficit

Interesting post at the Real Time Economics blog at the Wall Street Journal, noting that Treasury yields have risen somewhat in recent weeks, something which is [probably correctly] attributed to the rapid increase in the supply of Treasuries used to finance the enormous budget deficit.

While yields remain very low by historical standards, the Fed still wants them lower in order to push down other interest rates, the idea being that given a certain level of risk aversion, lower Treasury yields will lower other interest rates as well, and vice versa.

Since the deficit, and so the supply of Treasuries, will only get bigger during the new Obama administration, lower Treasury yields will require higher demand. To achieve that objective, the Fed could of course lower inflation expectations or increase risk premiums, but that would conflict with the reason they had in the first place for wanting to lower Treasury yields. That leaves them essentially with the option of monetizing the debt, by directly or indirectly buying Treasuries.

It's either that or the Fed accepting what chairman Bernanke thinks is the greatest possible evil: deflation. I see little reason to doubt that Bernanke will choose inflation over deflation, meaning that monetary inflation will likely get worse.

Value Of Pound Drops More Than 50% Versus Yen

The U.K. economy contracted more than expected, 1.5% (or 6% at an annualized rate) in Q4 2008 , the biggest decline since 1980. This further weakened the pound which fell to the lowest level against the U.S. dollar since 1985 and to a new all time low against the yen.

When this is written, one pound will only give you 1.355 dollars and 119 yen. To give you a perspective on just how dramatic this decline is consider that as late as June 22, 2007 (a mere 19 months ago), it took 124 yens to buy 1 U.S. dollar. The pound has in other words a lower value relative to the yen than the U.S. dollar had a mere 19 months ago. And also remember that 19 months ago, it took nearly (1.9975) 2 U.S. dollars to buy a pound. Relative to the yen, the pound has fallen from 248 to 119 yen, or 52%.

Thursday, January 22, 2009

Gold Production Is Falling

Interesting table, and statistics in The Economist: global gold production fell 4% in 2008. In many gold producing countries, including China, Russia, Peru and Mexico gold production rose, but that was not enough to compensate declining production in the United States, Canada, Australia, Indonesia and Australia.

This statistical fact is of course bullish for the price of gold (which I know many readers are interested of), especially if the trend continues.

A Feminist Economic Downturn

Whenever leftists start to look at average group differences, they immediately assume that "discrimination" or "patriarchal" or "racist" social structures are behind the fact that for example blacks and Hispanics earn less than whites (presumably the high earnings of Asians suggest that Asians are also involved in that racist conspiracy) or that men on average earn more than women.

When libertarian economics professor Walter Block after being asked about this suggested that these average differences might reflect average differences (or differences in variability) in abilities and other relevant factors, instead of discrimination, he was immediately denounced for that.

Keeping that in mind, it might be interesting to analyze how the slump has affected different groups. I have no data on average earnings for different groups, so I'll just settle for employment. For ethnic groups, the decline is pretty broad-based, everyone suffers, though Hispanics have suffered somewhat more than other due to their over-representation as construction workers.

But what is really striking is how different the crisis has affected male and female workers. Male unemployment (16 years and over) rose a full 2.9 percentage points in the latest year, from 5.0% to 7.9%. Female unemployment (16 years and over) rose a more moderate 1.6 percentage points, from 4.8% to 6.4%. The difference in trend is even more dramatic if you consider that the female participation rate actually rose slightly (from 59.4% to 59.5%) while the male participation rate fell (from 73% to 72.4%). As a result, the employment to population ratio fell far more dramatically for men (from 69.4% to 66.7%) than for women (from 56.5% to 55.7%). Relativeto population, male employment has dropped about 4% compared to just 1.4% for female employment.

I would naturally explain this by pointing to how sectors where men are over-represented, such as construction, have been hit disproportionately hard.

But if you accept the view that discriminatory social forces are the only possible explanation, doesn't this suggest that this crisis is the result of some feminist conspiracy designed to reduce differences in average outcome between groups. Yes, it would suggest that , but of course, it doesn't make any sense. But then again, neither did the original feminist theories.

Wednesday, January 21, 2009

Gordon Brown-The False Savior

Interesting story about how Gordon Brown has quickly lost the halo he gained after he allegedly saved the U.K. banking sector with a few wise pre-emptive moves a few months ago, something which has turned out to be not true as problems in the U.K. banking sector appears to get worse.

In two related notes, the U.K. government deficit is soaring at a rate unprecedented in peace time, while unemployment is soaring.

Non-Austrian Recognizes Austrian Insight

Nick Rowe at the "Worthwhile Canadian alternative" blog recognize one key insight in the Austrian business cycle theory:

"During the boom, the value of output and income appeared higher than it now appears to have been, because some investment was not as valuable as people thought it would be.

The validity of this Austrian insight does not mean we should follow the rest of the Austrian prescription, and just let the recession take its course. But neither should we ignore it.

We should recognise that it would be unwise to estimate potential output by extrapolating from past actual output. With hindsight, past actual output was less valuable than we thought it was at the time. (This was Stackelberg Follower's point, if I understand him correctly). More importantly in my view (since I am always leery of GDP, and even more leery of estimates of potential GDP), we need to recognise that the natural rate of unemployment will be temporarily higher than it once was as workers reallocate."


The point that was recognized here was then that because much of the production capacity really is just malinvestments, then "potential output" is in fact far lower than Keynesian models would recognize. And that is certainly an important insight.

Yet he insists that this does not imply that we should follow all Austrian ideas.
Of course, it is often the case that even thinkers who are generally clueless can often come up with some good ideas, and that recognizing that shouldn't compel us to also adopt their bad ideas as well.

But that doesn't mean you should ignore the analysis that produced these good ideas. And the reason why these malinvestments arose was because of previous monetary inflation, suggesting that additional monetary inflation will produce more malivestments.

And I do find this last comment curious:

"And Austrians: yes, I realise that the blueprints got magnified because interest rates were too low, but I couldn't make sense of the idea that monetary policy could set (real) interest rates too low in a world of perfectly flexible prices."

What Austrian has assumed that all prices are perfectly flexible? Rowe appears to confuse Austrians with New Classicals......

Tuesday, January 20, 2009

The Theoretical Basis For The Yen-Stock Market Link

It is a well-established empirical fact that whenever global stock markets fall, the yen and to a lesser extent also the Swiss franc tends to rise in value versus other currencies while for example the dollars of Australia and New Zealand tends to fall against other currencies. In recent months, the U.S. dollar has also started to move similarly to the yen. Of course, like every other empirical pattern, the correlation is not perfect (there have been brief periods when the yen has declined in value even as stock market values have declined), but most of the time it holds and the correlation can certainly be characterized as significant.

But while this empirical pattern is well-established, no real satisfactory explanation for it exists. When thinking about it, I first thought this was simply the result of technical factors, which is to say "quant" traders acting on historical relationships and buying yen whenever the stock market fell. Surely the relative attractiveness of Japanese assets and goods versus Australian assets and goods had nothing to do with the movements of global stock markets, I thought. But when thinking through the subject, I realized that there is in fact one reason to believe that Australian assets will be relatively less attractive compared to Japanese assets if stock markets falls.

I hinted at the reason in my previous post on the Canadian dollar, namely that if interest rates are generally trending downwards, then this will make currencies where interest rates can't fall further (because they are already zero or close to zero) more attractive. Since I prefer stating economic theoretical propositions in the form of verbal logic as opposed to Mathematics I will state this reasoning in the form of formal logic (Aristotelian syllogisms).

Premise: Interest rates are trending downwards when stock markets fall.

Premise: Certain countries had interest rates at or close to zero to begin with.

Premise: Interest rates can't fall below zero.

First conclusion: From these premises it follows that differences in interest rates will fall between high interest rate countries and countries with interest rates at or close to zero whenever stock markets fall.

Additional premise: Higher relative interest rates makes holding a currency more attractive and thus stronger, and lower relative interest rates makes holding a currency less attractive and thus weaker.

Conclusion: From the first conclusion and the additional premise it follows that lower stock prices will make currencies of high interest rate countries such as Australia less attractive and thus lower its value compared to currencies of countries where interest rates were close to zero to begin with, such as Japan.

This explains quite nicely why currencies of countries with high interest rates to begin with, such as the dollars of Australia and New Zealand and the U.K. pound has lost so much in value during the current bear market in stocks while the currencies of low interest rate countries such as Japan and Switzerland has gained in value. And this also explains why the U.S. dollar has stopped falling along with stock markets like it did in 2007 and early 2008, and has instead started to rise against most currencies . In the beginning, the U.S. had fairly high nominal interest rates (5.25%), and when they were reduced the dollar initially lost a lot of value. But once the U.S. had already joined the low interest rate club which previously only included Japan and Switzerland, the additional declines in stock market value would inevitably cause the interest rate differential against other countries to decline, and so strengthen the U.S. dollar.

Canada Heading For ZIRP

Canada reduces its short term interest rate to 1%, making it the lowest after the U.S., Japan and Switzerland. The Bank of Canada also hinted that it plans to cut more, pushing it closer to ZIRP (Zero Interest Rate Policy).

Canada has been hit hard recently by the slump in its main export market and by the decline in the price of oil and other commodities it exports. Because of that and the interest rate cuts from the Bank of Canada, the Canadian dollar is down nearly 30% against the USD since its peak in late 2007.

While the slump in exports will continue to weigh on the Canadian dollar and so push it even lower, it could soon reach its low. The global slump has so far benefited currencies where interest rates were low to begin with, which is to say the USD, the yen and the Swiss franc, as they have little room to fall further. That may soon start to benefit the Canadian dollar too.

Sunday, January 18, 2009

The Bush Failure

While it is roughly 1½ days left of the Bush presidency, and much longer time until all the data is available, I still don't think it is not too early to give a preliminary assessment of the Bush presidency. I will here focus on the economic aspects.

Assuming a 1.3% decline (5% decline at an annual rate) in Q4 2008, the economy grew 16.9% between Q4 2000 and Q4 2008, which is less than 2% at an annual rate. The equivalent number for the Clinton presidency was 3.6%, for papa Bush's presidency 2.1% and for Reagan's presidency 3.5%. Thus, the economy performed even worse than when his father was president, and much worse than during the Reagan's and Clinton's presidencies. If you adjust for population growth, these annual numbers are about 1 percentage point lower.

As was noted before, industrial production fared even worse, being virtually unchanged. The entire increase in GDP came in services, with government services increasing particularly fast, as the share of GDP going to government purchases rose to 17.6% in Q4 2000 to 20.4% in Q3 2008 (Some of that probably went into manufacturing of for example fighter aircrafts and other military equipment, but that only makes manufacturing of private products look even worse). The Q4 2008 numbers aren't ready yet, but considering the rapid decline in private sector output in that quarter and the spending increases suggested by the budget numbers, it will probably land at slightly below 21%.

This weakness is also reflected upon in the labor market, as unemployment rose from 3.9% to 7.2% even as the labor force participation rate fell from 67% to 65.7%. As a result, the employment to population ratio fell from 64.4% to 61%. While 5.7 million new jobs were created according to the household survey, that was nowhere enough given the increase in population.


Not that much of a "Bush boom" in other words. Now, to be fair, it would be wrong to blame Bush for the dismal performance during his presidency. He inherited an economy that was falling into a recession because of the tech stock bubble, and while the housing bubble in 2001-2006 did provide a limited boost, it also dragged down the economy in 2007 and 2008. By contrast, Clinton was really lucky to inherit an economy that was just recovering from recession and then enjoyed the pleasant phase of the tech stock bubble while leaving office just before the bust was apparent in growth statistics.

The main blunder of Bush was to reappoint the man guilty for the current problems, Alan Greenspan as Fed chairman, but then again that was a mistake also made by Reagan, papa Bush and Clinton. He also increased spending far too much (more on that below) and implemented policies that in the name of his "ownership society" vision aggravated the housing bubble. He did however also pursue some good policies, mainly the 2003 tax cuts, which did in fact create a lot of sound growth, particularly in 2003 and 2004.

When it comes to the budget, the most striking thing is the how much the budget balance weakened. In fiscal year 2000, the budget had a surplus of 2.4% of GDP whereas in fiscal 2008 it had a deficit of 3.2%. While that was below the post-World War II record of 6.0% in 1983, Reagan had inherited a large deficit from Carter and by the end of his term, the deficit was only slightly above where it started.

This reflected both a decline in tax revenues and a surge in spending. Revenues fell from 20.9% of GDP to 17.7%. This reflects in part how revenues in 2000 was inflated because of capital gains tax revenues from the inflated stock market and in part it reflect the active tax cut decisions made by Bush.

Spending at the same time rose from 18.4% of GDP to 20.9%. This increase is even worse if you consider that because of lower interest rates, interest payments fell from 2.3% to 1.7%. Excluding interest payments, spending rose from 16.1% to 19.2%, the most dramatic increase since World War II. To some extent Bush can blame this on cyclical factors, but he certainly shares a great deal of responsibility for this as he actively initiated several new spending programs, including the "No Child Left Behind" act, the Medicare drug benefit bill and of course the Iraq war. Also, during his first 6 years in office he only vetoed 1 spending bill from Congress, and that was a relatively minor one and also done for the wrong reason (I'm talking about funding of stem cell research).

After the Democrats won the 2006 congressional election, he did seem to improve. He proposed no new spending bills and started to veto several spending bills passed by the Democrats. However, once the financial crisis made a turn for the worse, so did Bush, who pushed for and implemented massive bailouts of Wall Street financial companies and Detroit car companies.

To summarize, while Bush has done a few good things, most notably his relative skepticism to the "global warming"-hysteria, the 2003 tax cuts and a few spending vetoes in his last few years, the overall assessment is very negative given his support for Greenspan, the massive increase in spending and the bailouts. Not surprisingly given how bad the policies were, the economic performance was also very weak. Because of those failures, he paved the way for the incoming Obama administration, who will continue and increase the dose of Bush's more destructive sides.

Saturday, January 17, 2009

Avoiding Falling Production By Reducing Production

One good example of how crazy the anti-deflation hysteria often is, can be found in this story, where the U.S. government may pay milk farmers to slaughter their cows in order to reduce milk production in the hope of raising the price of milk.

Usually, people argue against price deflation on the ground that it could cause output to fall. Which is to say, avoiding deflation is seen as a means to achieve the end of avoiding reduced output (Which it usually, but not always, isn't in reality). But here the focus on preventing the alleged scourge of deflation becomes so strong that they deliberately implement the scenario that the prevention of deflation was supposed to prevent in the first place!

The Return Of Checkable Deposits (And M1)

Until 1994, the quantity of demand deposits and other checkable deposits grew at roughly the same rate as other money supply components. And then, if you look at the historical statistics something happened. The quantity of checkable deposits fell back sharply during the mid 1990s and then stayed stagnant at roughly or somewhat above $600 billion, even as the quantity of currency in circulation and other forms of deposits kept rising.

The explanation for this new trend was that Alan Greenspan in 1994 permitted so-called sweep programs, which transferred perceived excess amounts in checkable deposits to money market accounts. The reason why banks wanted to do that was that checkable deposits have formal reserve requirements whereas money market accounts have no reserve requirements. And as I've explained before, banks have (or more correctly had as I note below) strong incentives to minimize reserves, as holding reserves means that they forego interest income and as the Fed's promise to always bail out banks with liquidity problems means that the old motive for holding reserves is gone.

This "deregulation" is perhaps the only "deregulation" which can be said to have played a small role in creating the tech stock and housing bubbles, as sweeps in effect meant that reserve requirements were lowered, something which especially in the context of central banks having removed the traditional motive for holding reserves distorted the markets and helped fuel credit expansion (as lower reserve levels made expanded balance sheets more profitable given a certain level of interest).

Anyway, because of the sweep programs, any increase in the amount of money that the public puts in checkable deposits will be quickly "neutralized" and transferred into money market accounts, which is why the quantity of checkable deposits were so stable from the mid-1990s until just recently. Because the narrow money supply measure M1 consists of currency plus checkable deposits (and traveler's cheques, but that amount is relatively trivial), this also meant that M1 became quite obviously irrelevant as the key component of checkable deposits had become a constant number that never changed regardless of monetary conditions. The entire increase in M1 from 1996 to 2008 consisted in the increase in currency in circulation.


But now something has happened again. If you look at the M1 graph, you can see that there has been a recent sharp increase in M1 which only to a minor extent can be accounted for by an increase in currency in circulation. Instead, as can be see in the graph below, checkable deposits have suddenly surged after having stayed basically constant for more than a decade. They have now for the first time exceeded the pre-sweep peaks.


The explanation for this is that the rules have again changed. Remember, the reason why banks have tried to minimize checkable deposits is that they have wanted to minimize required reserves. And the reason why they have tried to minimize required reserves is that they have had an opportunity cost in foregone interest. But now that the Fed has started to pay interest on reserves, that motive for minimizing reserves has been removed. And with no motive for minimizing reserves, this means that there is no motive for performing sweeps any more, which is why checkable deposits (and therefore also M1) have increased so dramatically recently.

This doesn't mean that I now think M1 is the proper money supply definition, but it won't be fully as irrelevant as it was from 1994 to late 2008.

Friday, January 16, 2009

U.S. Industrial Production Lower Than In 2000

U.S. Industrial production fell another 2% in December. The 12 month decline is now 7.8%, the biggest since 1982. Looking at manufacturing alone, the situation is even worse, with a 2.3% monthly decline and a 9.9% 12 month decline. The other two components, mining and utilities have held up fairly good, although I expect mining to start contracting soon due to the decline in commodity prices.

This sharp drop means that industrial production in December 2008 were actually lower than in December 2000 (indeed it is lower than in April 2000 as well), meaning that industrial production during the 8 years of Bush actually declined somewhat (No, I'm not blaming him, I'm blaming Greenspan, but it illustrates how deep the current slump is).

UPDATE: Here is a good chart that illustrates this fact:

Sweatshops Help Poor Workers

There are several different arguments offered for protectionism. "Right-wing" protectionists like Pat Buchanan believes it is good for the economy and/or that it "strengthens the bonds of the nation" if people can only trade freely within the country. Labor unions and business owners in sectors disproportionately competing with imports believes in it because they believe it will benefit them at the expense of the rest of society. Unions also often oppose it because of the increase in company bargaining power if companies have the option of moving production offshore.

The perhaps most curious and absurd defense of protectionism comes from certain leftists, who argues that imports of goods produced by low income workers shouldn't be stopped because it supposedly hurts us, but because it hurts the workers producing the goods, who are being "exploited" because of global capitalism. Some of those advancing that argument don't actually believe in it, and simply uses it because it sounds nobler than wanting to shield American workers from competition. Which is why they say they push for "fair labor and environmental standards", which in practice means that those who don't live up to those though standards should be prevented from exporting to America (or whatever country it is that implements these standards) But there are many leftists that actually believe in this.

Which is why this article by Nicholas Kristof is important. It points out that while sweatshops may not appear good for us, they are in fact a lot better than the alternative for those that work there. And it points out that if you want to improve conditions for workers in poor countries, you should buy more of their products, because that will increase demand for workers and so enable workers to demand better pay and/or working conditions. The rapid wage increases in China in recent years are a good example of this mechanism in practice.

Thursday, January 15, 2009

Relative European Inflation Movements

In line with the preliminary estimate, euro area consumer price inflation fell from 2.1% in November to 1.6% in December, a decline which together with the low level of money supply growth and the economic contraction in the euro area helped push a reluctant ECB to another interest rate cut today.

What is interesting is the movement of relative inflation within the euro area. Holland which for years have had the lowest inflation rate within the euro area, had an inflation rate above the euro area average for the first time in a long time. By contrast Spain, who have had above average inflation for almost the entire existence of the euro, now for the first time saw its inflation below the average. While the euro area average fell from 3.6% in September to 1.6% in December, Spain saw a much larger decline, from 4.6% to 1.5%.

This is similar to how Ireland who also for a long time had above average inflation, previously this year saw its inflation rate fall below the average, something which I discussed in the post "The Irish-Spanish Divergence". But at that time, Spanish inflation remained stubbornly high, something which I thought was puzzling given the Spanish housing bust, but thought was most likely due to the continued high level of immigration. But since then, the Spanish economic contraction has gotten a lot worse while Spanish authorities have taken a lot tougher stance against immigrants, both likely contributing to a radical reduction in immigration. Fewer immigrants may in the short-term (given inflexible wages) limit the increase in unemployment, but it will also further reduce demand for housing, and so aggravate the housing bust.

Another country with particularly large declines in inflation is Luxembourg and also Estonia and Latvia (though the 12 month increases are still well above average for them). Luxembourg is hard hit by the crisis not so much because of a housing bubble, but because it is more dependent than any other country on the crisis struck financial sector. This illustrates that within a monetary union, or between countries with fixed exchange rates, price inflation will be highly correlated with real economic growth. This is part due to the Balassa-Samuelsson effect and in part due to the fact that credit and therefore also money tends to move from relatively weak to relatively strong regions.

By contrast, no similar mechanism exist with floating exchange rates, as low growth countries often experience lower interest rates and currency depreciation, something which fuels price inflation. One good example of this is the U.K. which has seen its inflation rate rise from below euro area average to well above it, as the pound has fallen sharply against the euro. Another example is Iceland, which despite facing the most severe slump of any European country has seen its inflation rate rise from an already high 15.4% to 21%.

Wednesday, January 14, 2009

Increasing Inventory Glut

The headline on Bloomberg News said "business inventories decline for third month" [In November]. That is true if you look at the nominal value, but considering the price deflation during that period, the real inventory level probably rose. And compared to business sales, which fell 5.1% in nominal term versus only 0.7% for inventories, inventories rose sharply, and are now at their highest level since 2001. Considering how there has been a structural decline in inventories over time, excess inventories are arguably much higher than in 2001. And as you can see in the chart below, the increase in inventories is far higher than it was in 2001.

This is yet another indicator that the slump is far from over, as companies will be forced to deal with the excess inventories by reducing production.

Tuesday, January 13, 2009

Multiplier Nonsense

Arnold Kling comments on the discussion among various Keynesians like Paul Krugman, Cristina Romer and Greg Mankiw on the "multipliers" of various forms of "stimulus":

"It is amazing what happens when you assume that you live in a linear world. You say that the multiplier for government spending is 1.57.

Really? Over what range? Think of it this way: at which level of additional government spending would the path of U.S. real GDP be the highest?

(a) $100 billion in spending above the baseline
(b) $1 trillion in spending above the baseline
(c) $100 trillion in spending above the baseline

If you use a constant multiplier of 1.57, the right answer is (c). Yet we know that this is not the right answer. At $100 trillion in additional government spending, the United States would be operating like Zimbabwe, with similar results."


Indeed, why not go for a quadrillion dollars? That would make all Americans multi-millionaires!

This exercise in Bastiat-style Reductio ad absurdum teaches us two important lessons: First of all, there are no constant multipliers or other quantitative relationships in economics (except for functional ones, like 4% interest rate on a $100 million loan means $4 million in interest payments). Whatever "multiplier" that may have existed in one country in one time for a specific package will not hold in other countries, or the same country in a different time or even the same country at the same time with a different quantity. Any such relationship, even if estimated correctly (and there are good reasons to doubt that), is a historical fact for a specific circumstance, not a timeless theoretical relationship.

And secondly, fiscal stimulus will not necessarily have positive net effects, otherwise $100 trillion or quadrillion packages would bring us to unprecedented instant prosperity. The use of borrowing and/or "printing presses" will inevitably crowd out private investments and create price inflation, which will depress output.
That doesn't mean that the reverse is true, that all "fiscal stimulus" will be meaningless or have negative net effects. If focused on incentive improving tax cuts during a period of declining credit demand (like now), it will probably have positive net effects. But what it does mean is that "fiscal stimulus" will always have both positive and negative effects, and that for badly designed "fiscal stimulus" the negative effects are likely to be bigger, particularly if you take a long term perspective.

The Rapid Decline In World Trade, Protectionists & Job Creation

Protectionists frequently blame job losses on global trade. If it weren't for those damn foreigners selling us such good and cheap products, everyone would have a good job.

Well, now it appears that protectionists are getting their wish. Regardless of what country you look at, trade reports show dramatic declines in world trade. In some countries exports decrease more than imports, in others imports decrease more than exports, but in all countries both exports and imports are falling rapidly.

Today's U.S. trade report is a case in point. It showed a much greater than expected decline in the trade deficit, from $56.7 billion to $40.4 billion. This dramatic decline did not however reflect an increase in exports. Exports fell in fact 5.9%, from $151.5 billion to $142.8 billion. The reason for the decline in the deficit was then a 12% decline in imports, from $208.2 billion to $183.2 billion.

Exports in November 2008 at its lowest level since September 2007, while imports were at its lowest level since April 2006. Since its July 2008 peaks, exports have fallen 15.2%, from $168.4 billion to $142.8 billion, while imports have fallen 20.2%, from $229.5 billion to $183.2 billion.

Now that those pesky foreigners have dramatically reduced their shipments to America, that must mean that good American jobs are quickly returning, right? Just like you know that dramatic decline in world trade during the 1930s was associated with a lot of new jobs. Or maybe not.....

Monday, January 12, 2009

Overvalued Yen Causes Toyota To Buy Korean

I have indicated in recent weeks that I no longer regard the yen as undervalued (as I did before), and I now regard it as overvalued against most currencies. The reason for this shift in opinion is not that I think I was wrong in the past, but that the value of the yen has since then appreciated dramatically, 23% in 2008 alone against the U.S. dollar and even more against all other mayor currencies except the Swiss franc and the yuan. The gain was particularly dramatic versus the currency of its close neighbor and competitor, South Korea, with the yen rising 66% against the South Korean won. At this point, the yen is certainly overvalued against the won.

The effects of this overvaluation can be seen in the fact that troubled Japanese car giant Toyota according to this article in Times Online has decided to break its old "buy Japanese" tradition and buy steel for its cars from Korean steel makers.

The article also reports of other companies shifting purchases to South Korea and many Japanese shoppers indulging in "strong yen shopping binges" in Seoul.

Sunday, January 11, 2009

And You Thought I Was Bearish

Here is a forecast that makes me and other supposed perma-bears like Peter Schiff, Jim Rogers, Mike Shedlock and Nouriel Roubini look like extreme bulls in comparison. The people behind that forecast are really going to far in their pessimism......

From +52% To -12%

So-called analysts are now forecasting a 12% decline in profits for Q4 2008. It didn't seem so long ago that these same analysts forecasted a gain in profits of 52% for Q4 2008, in order to reassure their clients that buying stocks were a good idea. That 52% forecast was justified by the base effect of very low profits in Q4 2007 due to large write downs in the financial sector, so a 12% decline from that very low level is actually a lot worse than it sounds. And even that might be over-optimistic. The near 45% decline in corporate income tax revenues I reported about yesterday certainly hints that corporate profits are collapsing.

Not surprisingly though, these same analysts now reassure us that Q4 2008 is "old news" and that the low numbers for 2008 will create a base effect that will create positive profit growth in 2009, just as they predicted a 52% gain for Q4 2008 based on the same reasoning earlier. They will again be proven wrong.

Saturday, January 10, 2009

Obama Deficit May Exceed $1.5 Trillion

The Congressional Budget Office forecasted the other day that the U.S. federal deficit will rise as high as $1.2 trillion. And that forecast rests on the assumption that no "stimulus package" will be implemented. Add the package of $775 billion over 2 years, which translates into $387.5 billion per year, and the deficit will exceed $1.5 trillion.

Note also that this $1.2 trillion figure rests on the assumption that much of the TARP (aka Wall Street and Detroit bailouts) outlays should not be counted as "costs" but "investments". That is not necessarily an invalid approach as it is unlikely that all assets acquired through TARP will be completely worthless, but their estimate of the value of those assets are probably over-optimistic and this means that there is not a case for arguing that these deficit numbers are exaggerated.

The numbers for the first 3 months of fiscal 2009, the fourth quarter of the calendar year 2008, confirms that even without the stimulus package, the deficit will rise well above a trillion dollar. Tax revenues fell nearly 10%, from $606 billion to $548 billion, while spending rose roughly 45%, from $713 billion to $1,032 billion, causing the "cash based" deficit to rise from $107 billion to $485 billion. Bailout spending were $259 billion, of which the CBO claims $182 billion should be regarded as "investments" and the remaining $77 billion as costs. Even accepting that optimistic assumption we're still talking about an increase in the deficit of nearly $200 billion in just 3 months, which would translate into a 12 month increase of $800 billion. With the slump deepening, this underlying increase will likely accelerate, but on the other hand the inclusion of the tax rebate in the year ago numbers will limit the increase. Add that to the fiscal 2008 deficit of $455 billion, and you end up with a deficit of over $1.2 trillion.

The biggest decline in revenues comes from corporate income taxes, which saw a decline of nearly 45%. That suggest that corporate profits are collapsing. But other sources of revenues, including payroll taxes and personal income taxes also declined, reflecting the deep economic contraction. Meanwhile, government spending excluding interest payments and bailouts boomed like never before, rising as much as 12%. Jobless benefits and other hand-outs increased most dramatically, but military and Medicare spending also showed double digit increases. In addition to that were as mentioned before the new spending category of bailouts. The one spending post that showed a decline, and a quite dramatic (27.6%) one, was interest payments. One might have expected interest payments to rise given how dramatically the level of federal debt is increasing, but this effect is more than off-set by the even more dramatic decline in interest rates on government securities, particularly short-term securities.

It is thus now a foregone conclusion that the deficit will rise above a trillion dollar, and well above a trillion dollar. And it is looking increasingly likely that it will rise above $1.5 trillion, or more than 10% of GDP (the highest since World War II), even if you do not include all outlays for TARP.

Friday, January 09, 2009

Krugman Already Offers Spin For Obama Failure

It seems that Democrats are already doing everything they can to spin the coming failure of the soon to be inaugurated Obama administration to create a sustainable recovery from the current deep slump. Obama himself tries to do this by claiming that if his plans aren't implemented we will face years of crisis.

Paul Krugman for his part tries to again disassociate himself from Obama. Krugman opposed Obama in the Democratic primaries, which is likely why he didn't get any job in Obama's administration even though he supported Obama during the general election. Now Krugman again starts to criticize Obama, claiming that his proposed stimulus package won't be big enough (Krugman didn't think Roosevelt's New Deal was big enough, so we shouldn't be surprised by that) and is too focused on tax cuts relative to spending increases ("only" 60%).

As Krugman correctly sense that the Obama package won't solve the problems, he is already starting to get disassociated from it, so that once the failure becomes apparent, he can say "see I told you so" and "explain" this by saying that Obama's "New Deal", like Roosevelt's, was too small.

U.S. Job Market Continues To Deteriorate

The U.S. job market continued the dramatic decline from recent months in December, with the payroll number (which the markets usually focus on) showing 524,000 fewer jobs, bringing total 2008 job losses to 2.6 million, more than half of which occurred during the fourth quarter. The numbers for previous months were again downwardly revised, and it seems almost certain that this number will also be downwardly revised. The less watched household survey number showed even greater losses, 806,000 and 3.0 million respectively. As a result, the unemployment rate rose during 2008 from 4.9% to 7.2%, despite a decline in the participation rate from 66.0% to 65.7%. As before, the decline was even more dramatic for the private sector, while government employment held steady.

The details looks even worse as the average week worked among those that have a job fell to an all-time low of 33.3 hours per week, down from 33.8 hours per week a year ago. This reflects a dramatic increase in part-time unemployment or underemployment, which is to say workers who have a part-time job, but would like to have a full-time job. Part-time unemployment rose to 5.2%, up from 4.7% in November and 3.0% in December 2007.

As a result of the decline in both employment and the average work week among those employed, hours worked in the private sector fell a full 1.1% in December compared to November, which is a lot for one month. Compared to December 2007, this number is down 4%.

As in the previous report, the one silver lining is that average wages for those that are still working as many hours as before continues to rise, as average hourly earnings rose another 0.3%. Given that the CPI likely fell in December, the real increase will be slightly more than that. The main cause of this gain is likely disproportionate job losses among low paid workers.

Yet this will not be nearly enough to compensate for the dramatic decrease in hours worked, so this report clearly indicates that the U.S. economy in December was as weak as ever during this slump.

Thursday, January 08, 2009

Lowering Expectations

Obama now says that if the government doesn't do anything, the current slump will last for several years. Saying that now of course provides him with a higher probability of perceived success by, as a continued slump would be interpreted as at least not having made things worse, while some form of recovery would be credited to him.

In reality, government intervention will ensure that the problems continue. While the "stimulus package" combined with higher doses of inflation might provide a recovery in at least official statistics, any such hypothetical recovery will likely be short-lived, and followed by more slumps, similar to the pattern of short-lived recoveries in Japan in the 1990s.

The way to provide a really lasting recovery would be to follow the more non-interventionist path of Warren Harding during the deep but very short-lived 1920-21 slump, as described by for example Jim Powell here.

Even Wal-Mart

To further underline the point I made yesterday about the deteriorating fundamentals for major U.S. corporations, even Wal-Mart is now experiencing problems. That is quite ominous since consumer spending is the least cyclical component of the economy (especially if you exclude the sale of cars, which Wal-Mart doesn't sell).

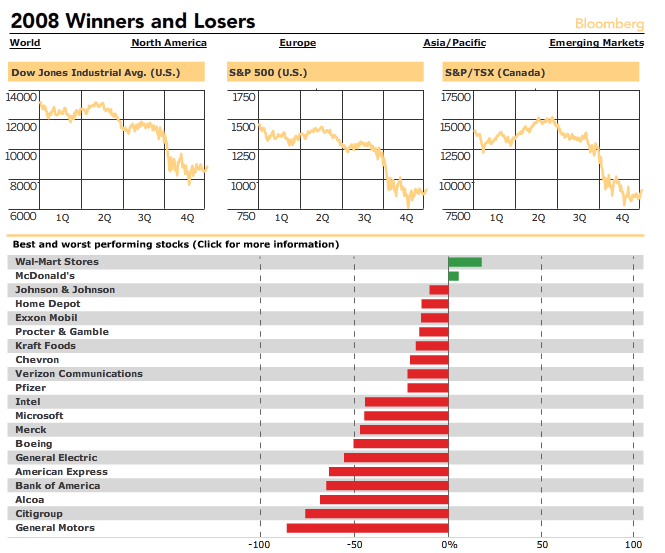
And Wal-Mart can in fact be expected to be even less cyclical, as it is a low price chains, and during periods of economic distress, low price goods and chains appear relatively more attractive. For such goods and chains, the "substitution effect" of low prices being a higher priority for consumers will counteract the "income effect" of consumers having less money to buy goods for, meaning that they will suffer a lot less or not all or even benefit during slumps. That was why Wal-Mart was the best performing stock of all major companies last year.

But as this latest announcement illustrates, the income effect is now becoming so great that it overwhelms the substitution effect, at least for Wal-Mart.

Wednesday, January 07, 2009

Hybrid Bust

I found another interesting item at the Planet Gore blog, even though many pundits have claimed that the reason for the problems of the Detroit auto makers is that they haven't been selling cars that are "climate friendly" enough, we are now seeing how so-called hybrid vehicles are performing much worse than cars only fueled by gasoline.

The reason is simple. Earlier this year when gasoline prices were high and nominal income growth higher, low fuel cars appeared a lot more attractive, though so-called hybrid vehicles have never reached a market share above 3%. But now that people are more insecure about paying high sums for a car, but less concerned with gasoline prices, people are turning away from the more "fuel efficient" but more expensive cars.

This illustrates that it is uncertain what cars will be popular in the future, and that politicians trying to impose such strategies on bailed out companies won't succeed (unless they cheat by using taxes or hand outs as incentives to promote their car models, but that will in any case cost a lot too).

Reality Sinks In For Wall Street

The massive increase in the money supply has triggered a big rally in the S&P 500, which is up more than 20% from its November 20 low. The problem with this rally is that it has been a purely liquidity driven rally. No real attractive alternative asset can be found as the massive liquidity glut has made almost everything look overvalued, and so some of the liquidity has spilled over to the stock market.

The problem is that the underlying fundamentals for stocks remain as terrible as ever, which reports of big job losses not to mention earnings warnings for 3 large companies, Intel, Alcoa and Time Warner today illustrates.

Perhaps the liquidity glut and the lack of good alternatives this has created can continue to prop up stocks despite deteriorating fundamentals. But as there has been periods in the past where high money supply growth didn't stop stocks from falling (for example in 2001), the risk is high of another sell off as the bad news continue to come in during the upcoming earnings season.

Monday, January 05, 2009

Tax Cuts Should Boost Private Savings

It is now reported that about 40% of the expected Obama fiscal stimulus plan will come in the form of tax cuts. Or at least, what is labeled as tax cuts, as some of the tax cuts he proposed during the campaign weren't really tax cuts, they were more like government transfer payments.

Anyway, if (with emphasis on "if") we are to have some kind of Keynesian "stimulus", then tax cuts are preferable to active efforts to achieve monetary inflation and spending increases. That is because first of all, tax cuts (at least genuine ones) improve incentives for productive efforts. And secondly, because they leave the decision of ultimate spending to private households, in sharp contrast to direct government spending (though this is also true of government transfer payments).

I now see that Harvard economics professor Ed Glaeser also favors tax cuts as the preferred method of stimulus. However, he appears to favor targeted tax cuts just for low income earners, because they are more willing to spend it, similar to the plan Obama presented during the campaign.

There are two problems with this: first of all, if you phase out tax cuts with rising income, you increase the marginal rate of taxation and so reduce incentives for productive efforts. And secondly, higher private savings is not a bad thing. Indeed, a key problem in the U.S. economy is that household savings remain too low and household debt remains too high. By boosting private savings and enabling a reduction in the level of private debt, firms will feel safer that households will be able and willing to buy their products in the future and so increase investments.

The large deficits that this plan presupposse will of course counteract this effect, as the fear of future tax increases will limit investment spending, which is why it is not a cure per se. But at least the negative effects of the deficit will be counteracted by the positive higher private savings. If the deficit is used for spending by contrast, the effect will be lower long term investment and so lower long term growth.

So, while "socializing" debt by increasing private savings through higher government deficits may not solve the problems, at least it won't aggravate them. If by contrast the deficit is used for spending, the problem with a too low savings rate will only be aggravated.

Monetary Policy Is Industrial Policy

John Taylor, most famous for having created the "Taylor rule" attacks the Fed for having abandoned monetary policy and instead embarked on "industrial policy":

"This doesn't really seem like quantitative easing in the sense of finding a growth rate in the money supply...What you are looking at now is really being determined by other considerations. How much should we buy of mortgage-backed securities? How much should we loan to foreign central banks? This is really more like an industrial policy,"

Yet what Taylor fails to realize is that monetary policy has always constituted a form of "industrial policy", even if it hasn't been as direct as now. Monetary policy has always impacted certain industries more than others, with investment good industries being more affected by changes in interest rates than (non-durable) consumer goods industries. Taylor's views stem from the classical fallacy among non-Austrians that somehow monetary policy is "neutral" in its impact on different industries, companies and individuals. In reality though, monetary policy has always had strong redistributive effects as newly created money in the banking sector has ended up in the mortgage sector, similarly to how the Fed pours money into mortgage backed securities now.

The only difference is that the Fed has decided not to use the banks as middle men, and instead is doing it directly, but the impact on the economy is the same.

Sunday, January 04, 2009

Current Global Money Supply Growth Rates

Is the global economy experiencing monetary inflation or deflation? That depends on which country you refer to. Below is a summary of the latest monetary statistics from various countries. For most countries I have simply stated one money supply figure, namely the one I think most closely resemble the proper money supply definition (As I discussed here and here, M1 and M2 have different meanings in different countries). For the U.S. I have several different definitions given the popularity of different definitions, and in order to illustrate why there has been monetary inflation despite deleveraging also the monetary base (MB). For China and Australia I also included two different definitions since I am uncertain to which extent the more narrow aggregate include deposits which should be included. In both cases the broader aggregate however clearly include deposits which shouldn't be included and as these deposits increase more than others, the true number is clearly lower than that of the broader aggregate.

USA (MZM):+11.9%
USA (M2) : +9,6%
USA (M1) : +16.4%
USA (MB) : +104.7%

Canada (M1++): +11.1%

Euro area (M1): +2.3%
Denmark (M1): +1.8%
Estonia (M1):-9.1%
Latvia (M1) :-8.8%

Sweden (M1
):+3.1%
UK (M1): +9.3%
Switzerland (M2): +6.2%

Japan (M2): +1.7%
China (M1): +6.8%
China (M2): +14.8%
Hong Kong (M2 HK$): -7.6%
Australia (M1): +6.4%
Australia (M3): +16.5%
New Zealand (M2): +14.9%

Saturday, January 03, 2009

Don Luskin's Failure To Connect Cause With Effect

Don Luskin, who as late as in September argued that there were no recession, now argues that the recession won't last forever. I actually agree with him in the sense that sooner or later, there will be some form of economic upswing. It might in fact (though that is far from certain) come as soon as this year as Obama and Bernanke implements extreme increases in the budget deficit and money supply, though any such recovery if it comes will not be sustainable as it would rest on an unsustainable level of money supply growth and budget deficit. This is similar to how Japan had short-lived upswings at least in official statistics in the 1990s whenever the level of "stimulus" was dramatically increased, only to soon experience another slump in what became a period of seemingly permanent stagnation.

Anyway though, what is most interesting is this section when he claims that bears are inconsistent:

"How often over the last 10 years have you heard that Americans don't save enough? That we're going to starve investment and growth because all we do is consume?

Now the same people who've been saying that all this time are saying that we face a permanent recession because consumers will save. Huh? How can the economy be doomed when consumers don't save, and also when they do save?"


Apparently Luskin can't see the difference between the cause of problems and the actual problems, or in this case the boom phase and the bust phase. This is a quite obvious distinction, which can be illustrated with many real life examples. Suppose for example that a soldier in a battle were warned not waste all of his ammo by shooting recklessly because that would result in him running out of ammo. By Luskin's "logic" that should be rejected that by saying "huh, how could shooting needlessly and not being able to shoot both doom you?". Or suppose that someone were warned not to stay up too late because then he would oversleep in the morning when he is supposed to go to work. By Luskin's logic that should be rejected by saying that "Huh? How could both not sleeping and sleeping be a problem?

The first phenomenon in all these cases weren't directly problematic in itself, but they were still problematic because they would lead to these later problems. Cause of problems, and the actual problems, respectively. That shouldn't be too difficult to understand.

Friday, January 02, 2009

The Benefits Of Lower Stock Prices

The issue of falling or rising prices is one of the subjects when most confusion exists. On the one hand politicians regularly denounces "price gouging", which is to say when they claim that companies keep prices too high, and that prices should be cut. In other contexts they depict price deflation as the worst possible calamity, a point where to quote one well-known Keynesian Telegraph columnist, we should "abandon all hope" (alluring to Dante's depiction of hell).

The reality is that falling prices is good for buyers, but bad for sellers. We all benefit when we have to pay less, but suffer when we are paid less. Whether or not particular or general price declines are good or bad for the overall economy is a somewhat complex issue which depends on exactly why and how prices are falling, an issue which I will not elaborate upon in this post ( I have however discussed this issue before, for example here, here and here). But the point in this context is that falling prices will produce both winners and losers-as will rising prices.

Note that this is not just true for consumer prices, it is just as true for asset prices. While people planning to sell their houses and stocks suffer from falling stock- and house prices, people who are planning to buy houses and stocks benefit from it. People who buy a home will have lower housing costs if they are able to buy their house cheaper. People who buy stocks will get the more dividends and other forms of positive future cash flow for any given investment if they are able to but stocks cheaper.

Yet the benefits of lower asset prices are even more rarely recognized than the benefits of lower prices of goods and services. When stock prices for example fall it is almost always referenced as "destruction of wealth", even though it should more appropriately be discussed as "redistribution of wealth". Even when it reflects deteriorating fundamentals (falling profits) due to malinvestments it is a symptom of "destruction of wealth" rather than being a form of wealth destruction in itself.

One exception to this to ignore the benefits of lower stock prices is this post from Dean Baker. Yet he focuses mainly on the benefits to people who don't trade in stocks, rather than the benefits to future stock buyers, which is somewhat misleading since not everyone eho abstains from buying or selling stocks benefits from lower stock prices. If current stock holders usually use their paper wealth to buy certain things, then this will lower the price of those goods, hurting the sellers of those goods while benefiting other buyers of those goods. Assuming for example that champagne are bought disproportionably by current stock holders, then falling stock prices will likely force champagne producers to lower their prices and so reduce their real income. But other buyers of champagne will see their real income rise as they pay less for their champagne.

In short, lower stock prices will hurt current stock owners, or more strictly future net sellers of stocks, as well as the people who disproportionably sell to these future net sellers of stocks. But future stock buyers, as well as other buyers of the things disproportionably sold by the future net sellers of stocks, will benefit from lower stock prices.

Thursday, January 01, 2009

Summary Of 2008 Currency Movements

This is a summary of the changes in exchange rates of various currencies versus the U.S. dollar. This summary doesn't tell the whole story of course as there were significant fluctuations within the year. Beneath the relatively small euro/dollar exchange rate movement (4.7%) for the year was a period of significant euro appreciation (8.9%) between December 31, 2007 and April 23, 2008, whereupon the exchange rate was relatively stable until July 15, when it closed marginally above that previous peak. After that, the euro fell some 21.3% until its November 20 low, after which it has gained 11.1%. Even so, the full year numbers are certainly of great relevance (Note, in cases where the exchange rate was expressed in the linked source in terms of the number of units of a currency it took to buy 1 USD (all currencies except the pound, the euro and the dollars of Australia and New Zealand) I inverted the numbers before making the calculations):

Yen: +23.0%
Yuan: +6.9%
Swiss franc: +6.1%
Singapore dollar:-0.1%
Euro: -4.7%
Swedish krona: -18.1%
Canadian dollar:-18.3%
Indian Rupee: -19.1%
Australian dollar: -20.4%
Norwegian krone:-22.1%
Brazilian real: -23.3%
New Zealand dollar:-24.3%
South Korean won: -25.8%
U.K. Pound:-26.3%